Global Software Asset Management Market Research Report – Segmentation By Component (Solutions, Services), By Deployment (On-premise, Cloud-based), By Organization Size (Large Enterprises, SMEs), By Industry Vertical (Manufacturing, IT & Telecom, BFSI, Government, Healthcare & Life Sciences, Retail & Consumer Goods, Media & Entertainment, Others), By Region – Forecast (2025 – 2030)
Published: 2025 - June
Report Code: IM-16537
Format:


Region: Global
Market Size and Overview:
The Global Software Asset Management Market was valued at USD 3.36 billion and is projected to reach a market size of USD 6.96 billion by the end of 2030. Over the forecast period of 2025-2030, the market is projected to grow at a CAGR of 15.68%.
Underpinned by increasing hybrid on‑premise/cloud environment software complexity, strict regulatory and compliance requirements, severe cost‑optimization demands, and quick digital‑transformation efforts, this growth is supported by The need to maximize rising software licensing and subscription costs, along with the growing complexity of contemporary IT environments spanning on-premise, cloud, and SaaS applications, and strong regulatory compliance demands, fuel the expansion of the market. Digital‑transformation projects in many sectors drive further demand for SAM solutions that offer end‑to‑end visibility, real‑time monitoring, and automatic license optimization.
Key Market Insights:
Cloud-based SAM solutions often dominate because of their scalability and remote access benefits, although on-premise installations are the fastest-growing as companies seek hybrid architectures to satisfy data-sovereignty and performance need.
Reflecting great acceptance of automated license‑management and discovery tools, the Solutions (software) segment held 74% of the market; Services (integration, consulting, support) represent the fastest‑growing component, addressing complex deployments and ongoing governance demands.
Software Asset Management Market Drivers:
The increase in IT complexity and the emergence of the Hybrid Environment have led to the increased popularity of this market.
Hybrid IT, combining on-premises, public, and private clouds, has broken software estates and pushed companies to handle licenses over several platforms. 62% of companies today work in multicloud settings, thus license discovery and compliance across AWS, Azure, GCP, and legacy systems becomes more difficult. SaaS sprawl, where departments independently subscribe to dozens of cloud applications, further deepens unmanaged license silos, elevating both overspend and audit risk. Given that every cloud provider has unique pricing policies and hidden costs, tools like Cloudaware highlight the need for unified multi‑cloud license monitoring to avoid over‑provisioning and unexpected bills with centralized metering engines. Major SAM vendors have reacted: Flexera purchased Certero in 2022 to strengthen hybrid-cloud governance; Snow Software's 2022 acquisition of Scalable Software added deeper slicing of SaaS and on-prem metrics, all to address integration complexity head-on.
Rules and regulations have helped the market to streamline its work and are a major market growth driver.
From GDPR-style audits to SOX, HIPAA, and vendor-enforced audit clauses, businesses confront a web of software-licensing rules that impose great compliance burdens. It is observed that major adopters of SAM to avoid penalties and keep audit-ready records are sectors with strict data-governance policies (e.g., healthcare under HIPAA). As unlicensed usage penalties can reach 10–20% of annual software spend, real-time entitlement management automatically mapping installations to license entitlements is now a must-have feature. RegTech innovations are changing compliance; AI-driven policy engines ingest global licensing contracts and dynamically enforce entitlements, therefore reducing manual audit preparation by as much as 60%. Of which SAM is a major component, the bigger Regulatory Compliance Management software market, valued at USD 27.8 billion in 2024, shows the increasing investments companies make in compliance tools.
The pressure of cost optimization has increased the need for this market as it helps in cost-saving.
Large-enterprise IT budgets estimate that software licensing and subscription costs account for 30–40%. This drives CFOs to pursue quick ROI through SAM rightsizing. SAM solutions help companies recover 10–15% of their yearly software expenditure by spotting underutilized or duplicative licenses, which adds millions in cost savings for sizable portfolios. Integration of SAM with spend analytics dashboards provides 20–25% improvements in budget accuracy and 15% cuts in renewals overpayment, according to research. Real-time usage metering and automatic contract-renewal notifications are essential to lock in cost savings and avoid invoice shocks given subscription-based licensing models multiplying, that is, where "per-user" fees accumulate daily.
The increasing digital transformation is considered a great market growth driver.
The worldwide drive for cloud-native architectures has propelled SAM from a back-office activity to a strategic enabler of digital-transformation roadmaps. Mirrored by the cloud ERP market’s predicted 16% CAGR to USD 172.7 billion by 2029, a recent poll shows 62% of IT decision-makers cite digital transformation as a top priority. With companies switching from on-premise ERPs to cloud-based suites, achieving 25% quicker feature roll-outs and 20% lower maintenance costs, IDC characterizes ERP modernization as “business transformation.” Simultaneously, 70.4% of worldwide ERP expenditure currently passes via cloud solutions—a number up from 69.8%, thereby confirming cloud-ERP as the major IT platform and strengthening SAM's role in governance across agile, subscription models.
Software Asset Management Market Restraints and Challenges:
High levels of costs related to implementation and maintenance are a huge challenge faced by the market.
For medium-sized companies, extensive SAM systems sometimes call for significant initial investments in tool licenses, discovery-agent deployment, and integration middleware, which can be more than USD 300,000 in the first year alone. Annual continuing operating costs, including infrastructure overhead, managed services contracts, and software maintenance payments, add another USD 100,000–200,000 each year, straining limited IT budgets. Basic functionality for entry-level SAM solutions still begins at USD 13,500 yearly for small and medium enterprises; advanced feature sets demand more than USD 50,000, therefore forming a significant barrier to uptake. Estimates for NASA's internal audit indicate a $3 million implementation cost and $2.5 million annual sustainment for its SAM program, therefore demonstrating how expenses can increase in large-scale settings. With 22% of IT leaders having paid over $5 million in software-audit costs in the last three years, Flexera's 2024 State of ITAM Report underscores the financial consequence of uncontrolled software spend. Just to get ready for vendor inspections, Information-Tech Research Group estimates that yearly audit procedures, staffed by committed teams, cost roughly $530,000. Meeting MEGABYTE Act goals, Deloitte's federal agency case study shows, might cut 30% of a $6 billion yearly software budget by $2 billion, but would need significant SAM investments to achieve.
Integrating the existing legacy systems with modern technologies is considered complex, which hampers the growth of the market.
Many businesses still operate proprietary license-management systems without contemporary API interfaces; hence, integrating projects depends on bespoke middleware and point-to-point connectors. Usually lasting 12 to 18 months, these customized solutions involve IT teams mapping legacy data models (such as EDI, proprietary vendor databases) to current RESTful APIs and performing thorough end-to-end testing to guarantee transactional correctness. Integration complexity is the most common obstacle to SAM adoption for 67% of companies, and when project deadlines slip, it frequently postpones ROI by 25% or more. Manual tasks bridge the gaps in technology, so accounts‑payable teams might build reconciliation backlogs of as much as 48 hours during peak billing cycles over extended rollouts.
There is a huge gap when it comes to skills and awareness among the public, which hinders market growth potential.
Effective SAM calls for trained professionals knowledgeable in software‑licensing rules, contract negotiation, and technical discovery tools, abilities that many SMEs lack. Only 40% of their digital‑asset management ratings are advanced, which leads to ongoing under‑utilization of SAM functions and dependence on manual spreadsheets for license tracking. Less than 25% of small companies in the United States have included payment or procurement APIs into their accounting procedures, compared to 65% of larger corporations, therefore emphasizing a digital‑skills gap. Language and localization obstacles add to this: 60% of SMEs in Latin America prefer training materials in Spanish or Portuguese, yet the majority of SAM providers only supply English documentation, therefore hindering adoption. Broadband access issues further slow down digital‑tool uptake; 20% of rural SMEs report unreliable connections that impair their capacity to effectively utilize cloud‑based SAM platforms.
The market faces challenges from platform interoperability, which impedes seamless operation.
Seamless data interchange is hampered by a fractured ecosystem of ITSM systems, procurement systems, and SAM solutions, each with unique data standards and authentication processes. Despite ISO/IEC 19770-1:2017's unified management-system standard and ISO/IEC 19770-2 and -3 defining SWID and entitlement tags, acceptance is still low: only two significant tools (1E's AppClarity and Sassafras's K2) have implemented the entitlement-tagging standard; SWID-tag usage is inconsistent. Hence, 28% of SAM consumers still do manual weekly reconciliations between SAM data and procurement systems to fix mismatches in order IDs and installation records. The slow adoption of open‑API and ISO 19770-compliant frameworks highlights the critical requirement for more industry cooperation on interoperability standards.
Software Asset Management Market Opportunities:
The rapid development in the Asia-Pacific region is seen as a great growth opportunity for the market.
Asia Pacific SAM market is expected to expand at a 19.9% CAGR owing to fast digitalization initiatives, including India's "Digital India" and China's "New Infrastructure" projects, which require enterprise software monitoring and optimization. With 23.3% of total global SAM revenues, the area emphasizes its increasing need for license compliance and optimization solutions. With projected Asia Pacific revenues of USD 2,600.1 million by 2030, this highlights major growth headroom relative to more developed North American and European markets. Government incentives for cloud‑adoption in countries like Australia and Singapore further accelerate SAM tool uptake, as public agencies invest in license‑governance frameworks to support e‑government services. Driven by flexible, pay-as-you-go models that reduce significant upfront costs, SMEs in fast-digitalizing countries like Vietnam and the Philippines are also increasingly subscribing to SaaS‑based SAM solutions. Dedicated SAM consoles are needed for multinational companies increasing their APAC footprints to handle several local software contracts and currency‑variant pricing.
Integration of IT and edge-computing systems has increased the demand for this market.
Anticipated to number 29 billion globally by 2030, IoT devices provide a new frontier for SAM that calls for discovery agents and license-tracking systems at the network edge to manage software operating on embedded controllers and gateways. Real-time analytics close to distant assets in sectors such as oil and gas help edge computing implementations generate demand for SAM solutions that can track licenses on edge servers where the link to central systems may be sporadic. To stop illegal software usage in dispersed locations, solutions like Flexera's edge-aware ITAM modules emphasize the need to combine on-device metering with central license-optimization engines. Early SAM adopters in manufacturing use IoT‑driven predictive‑maintenance systems, where embedded analytics workloads run on edge nodes and require continuous license‑compliance checks to satisfy audit requirements. Edge-deployed patient-monitoring applications in healthcare must be monitored for both safety-critical updates and licensing entitlements, therefore emphasizing the need for distributed SAM governance.
The use of automation and AI-enhanced analytics has led to increased efficiency in the market.
Leading SAM companies today include machine-learning models to predict under-utilization and analyze historical license-usage patterns, therefore making rightsizing recommendations that can recover 10–15% of software spend annually without manual intervention. AI-driven anomaly-detection engines flag unexpected spikes in usage, indicative of shadow-IT or non-compliant installations, cutting audit-prep times by up to 50% and lowering financial risks. AI agents in ITAM can automate regular reconciliation chores and trigger renewal alerts, freeing up IT staff to focus on strategic initiatives rather than spreadsheet-driven audits. SAM systems' advanced natural-language-processing capabilities enable them to ingest vendor-license agreements and extract important terms, such as usage metrics and audit clauses, thereby simplifying contract-management processes. AI-powered dashboards provide real-time forecasting of renewal costs under various negotiation scenarios, therefore helping procurement departments to plan budgets with greater accuracy.
The use of integrated software lifecycle management has helped in reducing discrepancies between orders and deployed software.
To manage software assets across the whole lifecycle from procurement and deployment to patching and retirement, next-generation SAM platforms are converging with IT Service Management (ITSM) tools and DevOps pipelines. Bidirectional workflows are made possible by integrations such as Azure DevOps connectors for ServiceNow, whereby change requests automatically spin up license entitlements during deployment and deprovisioning events remove access when code is retired. Since service-desk agents can see license availability and compliance status within incident records, combining ITSM and SAM lowers incident-to-resolution times by 30%. When SAM and ITSM teams work together, 40% of the discrepancies between procurement orders and deployed software drive tighter control over approved installations. License tracking is also automated by DevOps integrations inside CI/CD pipelines, therefore guaranteeing that microservices deployments and container images comply with license entitlements before they reach production.
Software Asset Management Market Segmentation:
Market Segmentation: By Component
• Solutions
• Services
The solutions segment dominates the market, and the services segment is the fastest-growing segment. Solutions (Software) include discovery agents, license-optimization engines, compliance modules, and analytics dashboards. Solutions made up 74% of SAM revenues, therefore highlighting the great use of automatic tools to handle complicated license portfolios. The Service sector includes consulting, integration, training, and managed support in services. With a strong >16.5% CAGR projected through 2030, services are the fastest-growing component as SAM deployments become more complex, especially in hybrid cloud/on–prem situations, addressing customization and governance demands.
Market Segmentation: By Deployment
• On-premise
• Cloud-based
The Cloud-based segment dominates the market, and the On-premises segment is the fastest-growing one. Delivered as SaaS, cloud-based solutions offer fast scalability, automatic updates, and remote accessibility. Cloud deployments had the greatest share since companies value operational agility and low front infrastructure expenses. Under the on-premises segment, installed there for more control over sensitive data and compliance. While smaller today, on-premise SAM is the fastest-growing deployment mode, growing at an estimated 17.8% CAGR, as companies pursue hybrid IT strategies and address data‑sovereignty requirements.
Market Segmentation: By Organization Size
• Large Enterprises
• SMEs
The Large Enterprises segment is the dominant one here, and the SMEs segment is the fastest-growing one. Defined as companies with more than 1,000 employees, large enterprises comprised 74% of SAM spend, motivated by extensive, worldwide software estates and significant audit exposure. The SMEs are companies with less than 1,000 employees; although smaller in absolute terms, the SME segment is the fastest‑growing one, growing at over 18% CAGR as subscription‑based pricing models and low‑code SAM tools reduce adoption barriers.
Market Segmentation: By Industry Vertical
• Manufacturing
• IT & Telecom
• BFSI
• Government
• Healthcare & Life Sciences
• Retail & Consumer Goods
• Media & Entertainment
• Others
Manufacturing had the biggest vertical share overall because of great software usage in automated production and supply-chain systems. It includes automotive, aerospace, and discrete-goods companies leveraging SAM for Industry 4.0 projects and license compliance. The Healthcare and Life Sciences covers hospitals, pharmaceuticals, and biotech, whereby rigorous legal systems (HIPAA, FDA) spur fast SAM adoption. With double-digit CAGRs projected during 2030 as companies maximize clinical-IT systems and confirm compliance, this vertical is the most rapidly developing.
Driven by the complex software estates in network operations and data centers needing continuous license optimization, the IT and Telecom vertical topped the global ITAM software market with a ~29% revenue share. Driven by rigorous regulatory audits and large financial-software portfolios requiring close compliance control, the Banking, Financial Services, and Insurance segment accounted for around 22% of SAM deployments. Digital-government projects driving mid-teens CAGR growth are causing government agencies to increasingly use SAM solutions to enforce audit compliance and maximize software expenditure across dispersed ministries and departments. As e-commerce and digital supply chain software grow, retailers and consumer goods companies use SAM to control omnichannel platforms and point-of-sale systems, therefore ensuring license compliance and cost management. Creative studios and broadcasters depend on SAM to control high-value content-creation suites and editing tools, therefore managing fast version changes and license checks in a segment defined by continuous software updates. Representing the balance of SAM deployments, this vertical (including energy, utilities, education, etc.) grows progressively as these industries need unified software control and begin digital transformation.
Market Segmentation: By Region
• North America
• Asia-Pacific
• Europe
• South America
• Middle East and Africa
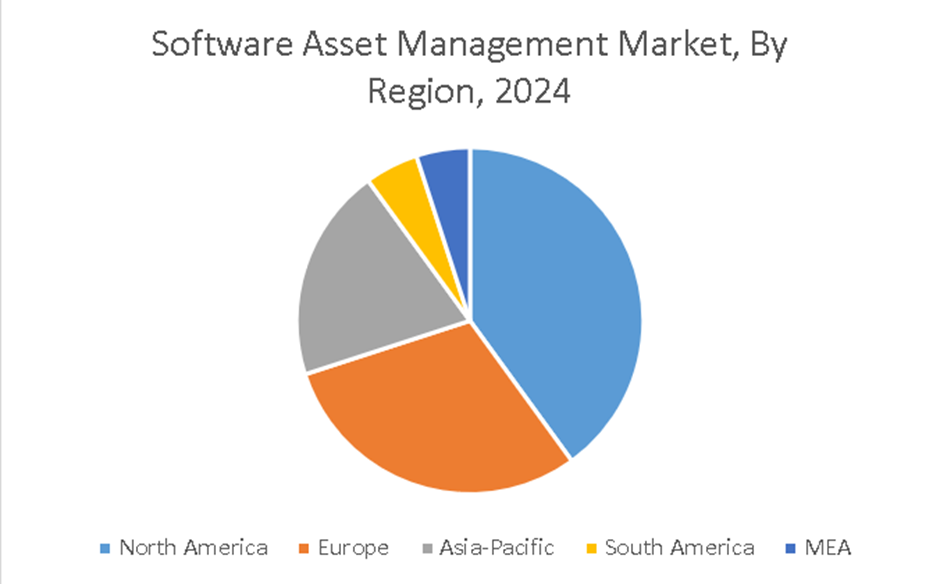
North America is the dominant region, and the Asia-Pacific region is said to be the fastest-growing region. Early cloud adoption and significant enterprise concentration helped North America, led by the U.S. and Canada, to have 43.1% of global SAM revenues. Asia Pacific consists of China, India, Japan, and Southeast Asia. RAPID APAC, set to reach USD 2.6 billion by 2030, is driven by government digitalization programs and fast enterprise-software expenditure growth, though accounting for 23.3% of revenues.
Driven by strict GDPR‑style licensing restrictions and extensive cloud migration across enterprise IT, Europe accounted for 23.3% of the global SAM market. With 5.4% of world SAM revenues, Latin America had growth driven by public-sector digitization initiatives and increasing private-sector software investments. With about 4.9% share, the MEA SAM market produced USD 152.7 million and is projected to expand at 18.2% CAGR through 2030 as governments and businesses update IT asset controls.
COVID-19 Impact Analysis on the Global Software Asset Management Market:
SAM adoption was sped along by the COVID-19 epidemic as companies changed to remote work models, exposing license management gaps and driving an urgent need for digital governance. Remote work and distributed software delivery amplified compliance risks and cost leakages, prompting 45% of large organizations to fast-track SAM deployments in 2020-2021. SAM platforms also supported the rapid onboarding of collaboration and security tools, therefore optimizing license utilization and providing an estimated 20% uplift in operational efficiency during the pandemic period.
Latest Trends/ Developments:
Machine-learning engines currently automate software usage baselining and predictive right-sizing, reducing audit-prep times by 50%.
Dedicated modules for SaaS subscription governance arise to manage dynamic user counts and consumption-based billing.
Covering 62% multicloud adoption rates, SAM suites combine with leading cloud providers (AWS, Azure, GCP) to control license entitlements across multicloud settings.
Real-time monitoring of license use, audit preparedness, and executive reporting enables continuous compliance dashboards with role‑based access.
Key Players:
• Snow Software
• Flexera
• USU Software AG
• Ivanti
• BMC Software
• ServiceNow
• Certero
• Matrix42
• Broadcom
• Eracent
Chapter 1. Global Software Asset Management Market–Scope & Methodology
1.1. Market Segmentation
1.2. Scope, Assumptions & Limitations
1.3. Research Methodology
1.4. Primary Sources
1.5. Secondary Sources
Chapter 2. Global Software Asset Management Market– Executive Summary
2.1. Market Size & Forecast – (2025 – 2030) ($M/$Bn)
2.2. Key Trends & Insights
2.2.1. Demand Side
2.2.2. Supply Side
2.3. Attractive Investment Propositions
2.4. COVID-19 Impact Analysis
Chapter 3. Global Software Asset Management Market– Competition Scenario
3.1. Market Share Analysis & Company Benchmarking
3.2. Competitive Strategy & Development Scenario
3.3. Competitive Pricing Analysis
3.4. Supplier-Distributor Analysis
Chapter 4. Global Software Asset Management Market Entry Scenario
4.1. Regulatory Scenario
4.2. Case Studies – Key Start-ups
4.3. Customer Analysis
4.4. PESTLE Analysis
4.5. Porters Five Force Model
4.5.1. Bargaining Power of Suppliers
4.5.2. Bargaining Powers of Customers
4.5.3. Threat of New Entrants
4.5.4. Rivalry among Existing Players
4.5.5. Threat of Substitutes
Chapter 5. Global Software Asset Management Market - Landscape
5.1. Value Chain Analysis – Key Stakeholders Impact Analysis
5.2. Market Drivers
5.3. Market Restraints/Challenges
5.4. Market Opportunities
Chapter 6. Global Software Asset Management Market– By Component
6.1. Introduction/Key Findings
6.2. Solutions
6.3. Services
6.4. Y-O-Y Growth trend Analysis By Component
6.5. Absolute $ Opportunity Analysis By Component, 2025-2030
Chapter 7. Global Software Asset Management Market– By Deployment
7.1. Introduction/Key Findings
7.2. On-premises
7.3. Cloud-based
7.4. Y-O-Y Growth trend Analysis By Deployment
7.5. Absolute $ Opportunity Analysis By Deployment, 2025-2030
Chapter 8. Global Software Asset Management Market– By Organization Size
8.1. Introduction/Key Findings
8.2. Large Enterprises
8.3. SMEs
8.4. Y-O-Y Growth trend Analysis By Organization Size
8.5. Absolute $ Opportunity Analysis By Organization Size, 2025-2030
Chapter 9. Global Software Asset Management Market– By By Industry Vertical
9.1. Introduction/Key Findings
9.2 Manufacturing
9.3 IT & Telecom
9.4 BFSI
9.5 Government
9.6 Healthcare & Life Sciences
9.7 Retail & Consumer Goods
9.8 Media & Entertainment
9.9 Others
Chapter 10. Global Software Asset Management Market, By Geography – Market Size, Forecast, Trends & Insights
10.1. North America
10.1.1. By Country
10.1.1.1. U.S.A.
10.1.1.2. Canada
10.1.1.3. Mexico
10.1.2. By Component
10.1.3. By Deployment
10.1.4. By Organization Size
10.1.5 By Industry Vertical
10.1.6. Countries & Segments – Market Attractiveness Analysis
10.2. Europe
10.2.1. By Country
10.2.1.1. U.K.
10.2.1.2. Germany
10.2.1.3. France
10.2.1.4. Italy
10.2.1.5. Spain
10.2.1.6. Rest of Europe
10.2.2. By Component
10.2.3. By Deployment
10.2.4. By Organization Size
10.2.5 By Industry Vertical
10.2.6. Countries & Segments – Market Attractiveness Analysis
10.3. Asia Pacific
10.3.1. By Country
10.3.1.1. China
10.3.1.2. Japan
10.3.1.3. South Korea
10.3.1.4. India
10.3.1.5. Australia & New Zealand
10.3.1.6. Rest of Asia-Pacific
10.3.2. By Component
10.3.3. By Deployment
10.3.4. By Organization Size
10.3.5 By Industry Vertical
10.3.6. Countries & Segments – Market Attractiveness Analysis
10.4. South America
10.4.1. By Country
10.4.1.1. Brazil
10.4.1.2. Argentina
10.4.1.3. Colombia
10.4.1.4. Chile
10.4.1.5. Rest of South America
10.4.2. By Component
10.4.3. By Deployment
10.4.4. By Organization Size
10.4.5 By Industry Vertical
10.4.6. Countries & Segments – Market Attractiveness Analysis
10.5. Middle East & Africa
10.5.1. By Country
10.5.1.1. United Arab Emirates (UAE)
10.5.1.2. Saudi Arabia
10.5.1.3. Qatar
10.5.1.4. Israel
10.5.1.5. South Africa
10.5.1.6. Nigeria
10.5.1.7. Kenya
10.5.1.8. Egypt
10.5.1.9. Rest of MEA
10.5.2. By Component
10.5.3. By Deployment
10.5.4. By Organization Size
10.5.5 By Industry Vertical
10.5.6. Countries & Segments – Market Attractiveness Analysis
Chapter 11. Global Software Asset Management Market– Company Profiles – (Overview, Product Portfolio, Financials, Strategies & Developments, SWOT Analysis)
11.1. Snow Software
11.2 Flexera
11.3 USU Software AG
11.4 Ivanti
11.5 BMC Software
11.6 ServiceNow
11.7 Certero
11.8 Matrix42
11.9 Broadcom
11.10 Eracent
Download Sample
Choose License Type
2850
5250
4500
1800
Frequently Asked Questions
The Global Software Asset Management Market was valued at USD 3.36 billion and is projected to reach a market size of USD 6.96 billion by the end of 2030. Over the forecast period of 2025-2030, the market is projected to grow at a CAGR of 15.68%.
North America leads with a 43.1% market share; Asia Pacific is the fastest-growing.
Solutions (software) and Services make up the segmented market; driven by automated license management and discovery capabilities, the Solutions segment is said to dominate the market.
Accelerated remote work adoption caused by COVID-19 revealed license gaps and expedited 45% of major companies to accelerate SAM deployments, resulting in a 20% effectiveness increase from improved software consumption.
High implementation costs (up to USD 300,000+ annually), 12–18 month integration schedules with legacy ERPs, skill and awareness gaps (only 40% of SMEs rate their digital skills as advanced), and fragmented API standards forcing 28% of buyers into manual reconciliation are major obstacles.


