Global Safe City Market Research Report – Segmentation By Solution (Video Surveillance, Access Control, Perimeter Intrusion Detection, Emergency Response System, Traffic Management, Others), By Service (Professional Service, Managed Service), By Deployment (On-premises, Cloud-based), By End-Use (Government & Defense, Transportation, Utilities & Energy, Retail & Commercial, Healthcare, Others), By Region – Forecast (2025 – 2030)
Published: 2025 - June
Report Code: IM-16549
Format:


Region: Global
Market Size and Overview:
The Global Safe City Market was valued at USD 25.23 billion in 2024 and is projected to reach a market size of USD 71.64 billion by the end of 2030. Over the forecast period of 2025-2030, the market is projected to grow at a CAGR of 23.21%.
Using IoT, artificial intelligence (AI)/analytics, and 5G, safe city solutions, including integrated video surveillance, access control, emergency response, and smart traffic management, improve urban resilience, lower crime, and augment public safety. Rising urbanization (68% of the world population in cities by 2050), government security initiatives, and developments in edge‑AI and cloud‑based monitoring propel development.
Key Market Insights:
Approximately 34% of 2024 income comes from integrated CCTV and AI-powered analytics as cities replace antiquated CCTV with intelligent, behavior-detecting solutions.
Driven by cities' need to move off‑balance-sheet OPEX, outsourced 24x7 monitoring, incident response, and system maintenance services grow at roughly 12% CAGR.
Capturing around 40% of installations as bandwidth and data-privacy infrastructure grow, cloud-hosted safe-city solutions offer scalable storage and real-time analysis.
Around 28% of all safe-city expenditures come from intelligent traffic management and automated license-plate recognition in road-safety initiatives.
Safe City Market Drivers:
The recent increase in urbanization and public safety mandates are major market growth drivers.
Driving safe‑city investments worldwide is the pace of urbanization; there are 33 megacities (populations > 10 million), a number set to rise to 40 by 2030, adding more than 630 million urban people to these megacities. Governments and local authorities are under pressure to keep public safety amid this fast expansion: higher population density is linked with greater crime rates, traffic accidents, and emergency-response needs. Many municipalities have therefore passed public-safety directives assigning specialized funds for command-and-control centers, integrated surveillance, and real-time analytical systems. Europe's Digital Europe Programme, for instance, has allocated € 75 billion for safe connectivity and digital infrastructure, most of which backs safe‑city deployments, while China's Safe City 2.0 initiative has invested over USD 21 billion into networked surveillance and AI‑enabled monitoring since 2021. These requirements make sure towns can scale sensor networks, video analytics stacks, and emergency‑response integrations commensurate with never-before-seen urban growth.
The recent advancements in the field of AI and video analytics are helping to transform this market.
Passive camera networks have become active safety systems thanks to edge-AI video analytics. An investigation revealed that an IoT-enabled anomaly-detection system attaining 95. 8% accuracy in detecting suspicious behaviors on resource-constrained edge devices, such as loitering, perimeter breaches, and unauthorized access, thereby lowering false alarms by over 60% in contrast to conventional techniques. Commercial systems today directly embed deep‑learning models (e.g., YOLOv8, EfficientNet) into smart‑camera firmware so allowing real-time on‑device detection of weaponry, abandoned baggage, and crowd‐density anomalies. Amazingly, these systems can handle hundreds of video streams concurrently at 30+ FPS without cloud dependencies, therefore lowering latency and bandwidth greatly. Cities are putting scalable video analytics clusters that trip automated alarms and interface seamlessly with dispatch systems as AI-model optimization methods advance, therefore providing a 40% quicker incident-response time in pilot projects.
The rise in government funding for the initiatives taken regarding smart cities is said to be a major market driver.
Government spending continues to be the basis of safe-city expansion. With governments all across supporting camera networks, analytical tools, and command centers to achieve public safety objectives, rising public‑sector spending on urban safety and security technologies dominates the 23.21% CAGR of the safe‑city market. The Digital Europe fund in Europe distributes € 7.5 billion to protect digital infrastructure, therefore incentivizing member nations to use video‑surveillance and analytics standards. Since 2021, China's Safe City 2.0 program has designated over USD 21 billion to support more than 200 smart‑city pilots using integrated IoT, 5G, and AI‑monitoring networks. India's Smart Cities Mission has set aside ₹48,000 crore (USD 6.5 billion) for urban renewal and safety initiatives to be carried out through 2024. These initiatives not only cover capital expenditures but also subsidize ongoing system integrations and operator training, allowing more municipalities to deploy end‑to‑end safe‑city platforms.
The integration of 5 G networks and IoT connectivity is helping this market to develop faster.
Safe‑city designs depend critically on 5G's ultra-high device density and low-latency capabilities. According to 3GPP specifications and sector studies, 5G can handle up to 1 million devices per square kilometer versus just 2,000 devices/km² under 4 G. Vast IoT installations, smart cameras, environmental sensors, and vehicle trackers, that provide real-time data into analytics engines, depend on this great connectivity. Furthermore, improving situational awareness for first responders, 5G's sub-10 ms latency enables mobile patrol units, drones, and augmented-reality interfaces to quickly share high-definition video and telemetry. Pilot programs in Asia and Europe have shown that 5 G-backed safe‑city networks may cut end‑to‑end streaming latency by 70%, hence facilitating sub‑second threat detection and automatic command‑center orchestration. The link between 5G and IoT will keep growing as 5G deployments around the world quicken, enabling new degrees of urban security and resilience, from automated patrols to real-time crowd control, unlocking safe‑city applications.
Safe City Market Restraints and Challenges:
The initial capital outlay for this market is very high, which hampers its adoption.
End‑to‑end implementation of safe‑city systems calls for great initial investments, sometimes surpassing USD 100 million for mid-sized towns. For example, Karachi's Safe City Project was initially budgeted at Rs. 44 billion (about USD 278 million), but even after a 50% decrease, it still came to Rs. 22 billion (about USD 139 million). Likewise, Quetta spent Rs 7.5 billion (~USD 27 million) on its 900-camera and command‑center network. Outlays for high-resolution cameras, IoT sensors, 5G/MEC upgrades, control-room equipment, and safe data storage are needed for these projects. Such capital investments extend budget cycles, slow down procurement, and sometimes call for multi‑year financing or public‑private partnerships to distribute expenses, a major obstacle for cities with tight fiscal resources.
The market faces hurdles through rules and regulations, and the problem of data privacy.
Safe‑city solutions automatically gather enormous quantities of video and IoT data, therefore activating strict rules for data privacy. Under GDPR, "data protection by design" calls for on‑device anonymization and minimal retention periods; meanwhile, CCPA and other local regulations impose explicit consent and breach‑notification processes. Putting these controls adds complexity to the system; cameras must include edge‑AI anonymization, encrypted data channels, and audit‑logging components. Furthermore, different local laws produce a mosaic of compliance requirements that municipalities have to negotiate, usually involving legal and privacy experts to create clear data-governance frameworks, therefore raising technical as well as professional-services expenditures.
The integration process with the legacy system is complex and slows down market operations.
Many cities run heterogeneous infrastructures, including legacy SCADA controls for utilities, analog CCTV networks, traffic management systems, and diverse agency databases, systems never built for integrated operation. Custom middleware, data-model harmonization, and API adapters, which might take up 20–30% of total project effort are needed to integrate these silos. Converting analog video feeds into IP‑native formats, for example, call encoder farms and video‑stream standardization; syncing event data across police, transportation, and utilities control centers usually calls for customized ETL pipelines. Usually running 6–12 months longer than greenfield deployments, these integration projects complicate timetables and raise the risk of system instability and cost overruns.
There is a huge shortage of skilled workers, which hampers market productivity.
Though few, competent individuals, video analytics experts, IoT engineers, network architects, and cybersecurity professionals, are vital for the efficient operation of safe‑city systems. Planning and public administration experts sometimes lack the technical skills required to manage complicated smart-city ecosystems, according to a recent MDPI analysis. Similarly, the EU-funded SmartDevOps project stresses the need for three new positions, Smart City Planner, IT Manager, and IT Officer, and claims that current curricula are not producing sufficient qualified candidates. Compounding this, secure-city duties often cross many departments, police, transport, utilities, each with its priorities and procedures, hence producing siloed decision-making and underuse of shared resources. One of the most urgent problems facing the industry is building a unified, multidisciplinary staff.
Safe City Market Opportunities:
The emergence of AI-powered predictive policing is said to be a major market growth opportunity.
Directing patrols to high‑risk grids, the PredPol system tested against conventional hotspot methods yielded a 27% fall in property crimes in Santa Cruz, CA, during the first month. Similarly, the FBI's controlled experiment in Los Angeles' Foothill Division showed that data‑driven patrol scheduling validated the effectiveness of algorithm‑generated hotspot maps by lowering property crime by 12% against a 0.4% rise citywide. Since its 2023 debut, the Punjab Safe Cities Authority's AI/ML-based system has allowed real-time crime forecasting and optimized resource distribution, early reductions in chain-snatching and theft incidents reported. These findings have promoted SaaS implementations, in which cities subscribe to predictive analytics solutions and work with academic institutions for ongoing model improvement, opening recurring revenue streams while providing clear public-safety benefits.
The rising popularity of use of drone-based surveillance and response presents an opportunity for the market to develop.
High‑resolution cameras, thermal sensors, and AI‑driven object‑tracking engines on unmanned aerial vehicles (UAVs) are quickly supplementing ground‑based networks. Driven by law enforcement and emergency response applications, the worldwide public safety drone market, valued at USD 1.2 billion, is projected to reach USD 2.6 billion by 2030 at a 12.6% CAGR. Driven by AI, drones can automatically survey huge crowds, recognize aberrant behaviour, and send live feeds to command centres with sub‑second latency, thereby expanding coverage to distant or dangerous regions. A PW Consulting analysis shows that AI-powered autonomous patrol drones can decrease manpower demands by 30% while improving situational awareness, and that legal systems are becoming increasingly accommodating of beyond‑visual‑line‑of‑sight (BVLOS) operations. Validating drones' contribution in future safe-city designs, municipal governments in South Africa and the UAE are testing drone fleets for crowd monitoring during major events and quick response during natural disasters.
The use of smart lighting and environmental monitoring is a major market development opportunity.
Smart streetlights create a digital umbrella that combines lighting with environmental and security sensors. Over 40% of municipal energy budgets are accounted for by conventional public illumination; LED-based smart lighting with adaptive dimming and motion detection can cut energy usage by 50–80%, as seen in pilot projects in Cleveland (20% cost reduction) and Rio de Janeiro (70% energy savings). Beyond illumination control, integrated air quality, noise, and humidity sensors feed data into safe-city platforms, enabling real-time hazard detection, such as identifying localized pollution spikes or traffic congestion through rapid analytics. Embedded-camera-and-microphone-arrays-can-also-detect-gunshots-and-aggressive-behaviors, automatically-alerting-public‑safety-dispatchers. By leveraging existing street light infrastructure, cities achieve dual ROI: significant energy savings and enhanced public safety monitoring with minimal additional civil works.
The emergence of cross-agency command centre platforms is transforming this market.
Digital twin-enabled command centers combine different agency systems, police, fire, EMS, and transportation into one situational-awareness interface. The SAFER platform of Frisco, Texas, exemplifies this approach: a GIS-driven digital twin maps real-time incident data, asset locations, and infrastructural schematics, therefore enabling coordinated dispatch and dynamic resource distribution across departments. Law enforcement reroutes patrols and transportation engineers remotely modify signal timings, all inside the same live map, when a traffic accident obstructs a primary artery. Likewise, Safe City Group's Intelligent Command and Control Center (ICCC) combines PSIM, traffic management, and emergency-call-box feeds to provide a consolidated operational view that lowers incident-response times by 30% and improves inter-agency cooperation. Demand for modular, low-code ICCC suites and professional-services integrations is exploding as cities use these integrated platforms, therefore driving fresh software and consulting revenue sources.
Safe City Market Segmentation:
Market Segmentation: By Solution
• Video Surveillance
• Access Control
• Perimeter Intrusion Detection
• Emergency Response System
• Traffic Management
• Others
The Video Surveillance segment dominates this market as cities modify old cameras to intelligent systems able to crowd‑density estimating, facial‑anomaly detection, and automatic event flagging, integrated CCTV and AI‑powered video analytics made for nearly 34% of worldwide safe‑city revenues in 2024. The Traffic Management segment is the fastest-growing, driven by smart-mobility projects and the need to lower urban congestion and emissions. Intelligent traffic solutions, including automated license-plate identification, adaptive signal control, and congestion-monitoring dashboards, are growing at about 11% CAGR.
About 16% of the market comprises physical and digital access-control systems, securing vital infrastructure and public services as cities impose more rigorous entry-management policies. The Perimeter Intrusion Sensor segment involves capturing around 12%, sensor-based intrusion detection (fence-mounted and open-area) is used mostly in government buildings and utilities. Systems for Emergency include Response Command-center software, mass-notification systems, and integrated dispatch instruments make up roughly 10%, hence helping coordinate incident management throughout departments. Including environmental sensors, public‑address systems, and location‑tracking technologies, the others segment satisfies specific safety and operational-monitoring requirements.
Market Segmentation: By Service
• Professional Service
• Managed Service
The Professional Services segment is said to dominate this market. 58% of service income is generated by consulting, system integration, and personalization services as cities customize safe-city platforms to distinctive regulatory and infrastructure environments. The Managed Services segment is the fastest-growing segment of this market. Managed Services rising at about 12% CAGR, outsourced 24x7 monitoring, incident‑response support, and software‑update services enable cities to transform major capital projects into predictable operational costs.
Market Segmentation: By Deployment
• On-premises
• Cloud-based
The On-premises segment is said to be the dominant segment of the market. With assured uptime and data sovereignty, security-critical organizations favor on‑premises deployments (servers and control centers housed in municipal data centers), accounting for almost 60% of installations. The Cloud-based segment is the fastest-growing segment of the market. With 5G backhaul and data-privacy frameworks maturing, cloud-hosted safe-city systems, which provide fast scalability, consolidated worldwide dashboards, and cheaper initial expenditures, are growing at around 14% CAGR.
Market Segmentation: By End-Use
• Government & Defense
• Transportation
• Utilities & Energy
• Retail & Commercial
• Healthcare
• Others
The Government & Defense segment is said to dominate the market. Leading national and local authorities invest in border-security integrations, command centers, and public-safety systems, representing about 30% of end-use revenue. The Healthcare segment is said to be the fastest-growing one. Driven by compliance and patient‑safety requirements, hospital campuses and public-health facilities are quickly embracing safe-city solutions, including patient-tracking and perimeter security, at around 13% CAGR.
In the Transportation segment, 28% of solutions for traffic management and transit‑hub monitoring help to maximize security and flow in airports, seaports, and metro systems. In the Utilities and Energy segment, 12% of Protection of essential infrastructure sites (power plants, water treatment) uses perimeter-intrusion and video analytics technologies. The Commercial and Retail segment, accounting for 10%, includes smart malls and business areas that use integrated surveillance for crowd control and loss avoidance. The Others segment includes cultural-heritage sites, sports stadiums, and educational campuses using bespoke safety systems.
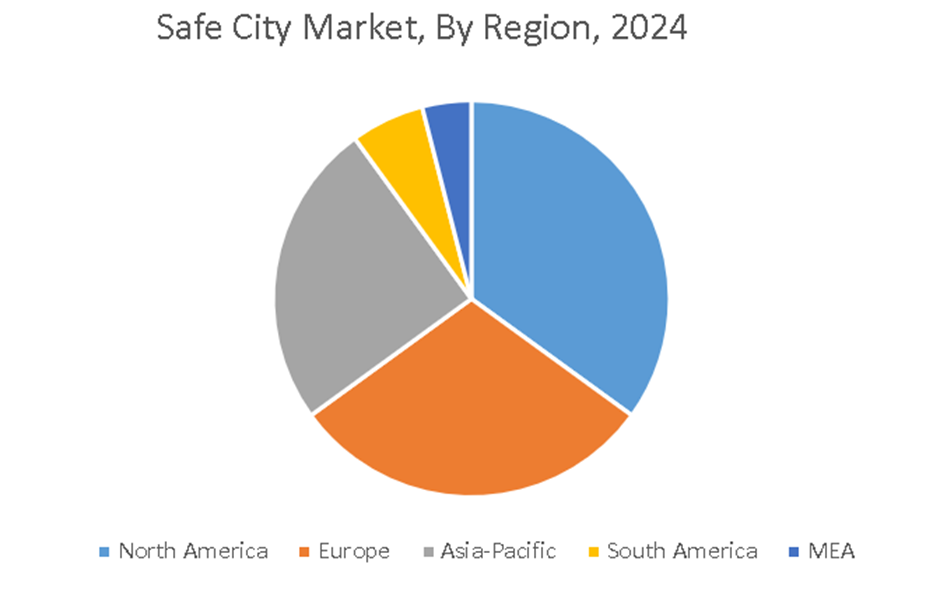
Market Segmentation: By Region
• North America
• Asia-Pacific
• Europe
• South America
• Middle East and Africa
North America rules. Early smart-city projects, mature security regulations, and high per-capita expenditure on safety technology all help to make North America the leader with roughly a 35% share. The Asia-Pacific region is the fastest-growing region. Driven by China's national "Safe City 2.0" campaign and India's urban-safety programs under the Smart Cities Mission, APAC is expected to increase at an approximate 12% CAGR.
Europe accounts for about 26% and has interoperable GDPR‑compliant systems installed throughout smart‑city initiatives across the EU. Led by Brazil and Argentina's investments in public-safety modernization and traffic-control improvements, Latin America captures approximately 11%. The Middle East and Africa region is supported by Gulf‑region smart‑city and security‑infrastructure expenditure as well as South African urban‑safety project expansion; MEA accounts for around 8%.
COVID-19 Impact Analysis on the Global Safe City Market:
The COVID-19 pandemic is said to have a major impact on this market. As cities sought to balance health monitoring with privacy, many adopted hybrid cloud models and edge‑AI for safe, local analytics, keeping high safe‑city budgets even as overall municipal spending normalized. The investment in this market grew by 10 to 15%. A rapid deployment of thermal imaging cameras, social distancing analytics, and AI mask detectors in various public spaces was seen. It focused on the need for contact tracing, monitoring of public health, and management of the crowd.
Latest Trends/ Developments:
Event detection accelerated due to the use of next-gen cameras that come with AI, which helped in enhancing privacy and reduced the bandwidth by around 70%.
Live sensor feeds are incorporated into 3D city models for resource optimization and predicted incident management.
High-bandwidth, low-latency coverage in places without fixed infrastructure is made possible by vehicle-mounted and drone-based 5G units.
Using blockchain, immutable audit trails for video and sensor data help to guarantee evidentiary integrity and chain of custody.
Key Players:
• Hikvision
• Dahua Technology
• Axis Communications
• Bosch Security Systems
• Johnson Controls
• Honeywell International
• Cisco Systems
• NEC Corporation
• Genetec
• Huawei Technologies
Chapter 1. Global Safe City Market–Scope & Methodology
1.1. Market Segmentation
1.2. Scope, Assumptions & Limitations
1.3. Research Methodology
1.4. Primary Sources
1.5. Secondary Sources
Chapter 2. Global Safe City Market– Executive Summary
2.1. Market Size & Forecast – (2025 – 2030) ($M/$Bn)
2.2. Key Trends & Insights
2.2.1. Demand Side
2.2.2. Supply Side
2.3. Attractive Investment Propositions
2.4. COVID-19 Impact Analysis
Chapter 3. Global Safe City Market– Competition Scenario
3.1. Market Share Analysis & Company Benchmarking
3.2. Competitive Strategy & Development Scenario
3.3. Competitive Pricing Analysis
3.4. Supplier-Distributor Analysis
Chapter 4. Global Safe City Market Entry Scenario
4.1. Regulatory Scenario
4.2. Case Studies – Key Start-ups
4.3. Customer Analysis
4.4. PESTLE Analysis
4.5. Porters Five Force Model
4.5.1. Bargaining Power of Suppliers
4.5.2. Bargaining Powers of Customers
4.5.3. Threat of New Entrants
4.5.4. Rivalry among Existing Players
4.5.5. Threat of Substitutes
Chapter 5. Global Safe City Market- Landscape
5.1. Value Chain Analysis – Key Stakeholders Impact Analysis
5.2. Market Drivers
5.3. Market Restraints/Challenges
5.4. Market Opportunities
Chapter 6. Global Safe City Market- By Solution
6.1. Introduction/Key Findings
6.2. Video Surveillance
6.3. Access Control
6.4. Perimeter Intrusion Detection
6.5. Emergency Response System
6.6. Traffic Management
6.7. Others
6.8. Y-O-Y Growth trend Analysis By Solution
6.9. Absolute $ Opportunity Analysis By Solution, 2025-2030
Chapter 7. Global Safe City Market– By Service
7.1 Introduction/Key Findings
7.2. Professional Service
7.3. Managed Service
7.4. Y-O-Y Growth trend Analysis By Service
7.5. Absolute $ Opportunity Analysis By Service, 2025-2030
Chapter 8. Global Safe City Market– By Deployment
8.1. Introduction/Key Findings
8.2. On-premises
8.3. Cloud-based
8.4. Y-O-Y Growth trend Analysis By Deployment
8.5. Absolute $ Opportunity Analysis By Deployment, 2025-2030
Chapter 9. Global Safe City Market– By End-Use
9.1. Introduction/Key Findings
9.2. Government & Defense
9.3. Transportation
9.4. Utilities & Energy
9.5. Retail & Commercial
9.6. Healthcare
9.7. Others
9.8. Y-O-Y Growth trend Analysis By End-Use
9.9. Absolute $ Opportunity Analysis By End-Use, 2025-2030
Chapter 10. Global Safe City Market, By Geography – Market Size, Forecast, Trends & Insights
10.1. North America
10.1.1. By Country
10.1.1.1. U.S.A.
10.1.1.2. Canada
10.1.1.3. Mexico
10.1.2. By Solution
10.1.3. By Service
10.1.4. By Deployment
10.1.5. By End-Use
10.1.6. By Region
10.2. Europe
10.2.1. By Country
10.2.1.1. U.K.
10.2.1.2. Germany
10.2.1.3. France
10.2.1.4. Italy
10.2.1.5. Spain
10.2.1.6. Rest of Europe
10.2.2. By Solution
10.2.3. By Service
10.2.4. By Deployment
10.2.5. By End-Use
10.2.5. By Region
10.3. Asia Pacific
10.3.1. By Country
10.3.1.1. China
10.3.1.2. Japan
10.3.1.3. South Korea
10.3.1.4. India
10.3.1.5. Australia & New Zealand
10.3.1.6. Rest of Asia-Pacific
10.3.2. By Solution
10.3.3. By Service
10.3.4. By Deployment
10.3.5. By End-Use
10.3.6. By Region
10.4. South America
10.4.1. By Country
10.4.1.1. Brazil
10.4.1.2. Argentina
10.4.1.3. Colombia
10.4.1.4. Chile
10.4.1.5. Rest of South America
10.4.2. By Solution
10.4.3. By Service
10.4.4. By Deployment
10.4.5. By End-Use
10.4.6. By Region
10.5. Middle East & Africa
10.5.1. By Country
10.5.1.1. United Arab Emirates (UAE)
10.5.1.2. Saudi Arabia
10.5.1.3. Qatar
10.5.1.4. Israel
10.5.1.5. South Africa
10.5.1.6. Nigeria
10.5.1.7. Kenya
10.5.1.8. Egypt
10.5.1.9. Rest of MEA
10.5.2. By Solution
10.5.3. By Service
10.5.4. By Deployment
10.5.5. By End-Use
10.5.6. By Region
Chapter 11. Global Safe City Market– Company Profiles – (Overview, Product Portfolio, Financials, Strategies & Developments, SWOT Analysis)
11.1. Hikvision
11.2. Dahua Technology
11.3. Axis Communications
11.4. Bosch Security Systems
11.5. Johnson Controls
11.6. Honeywell International
11.7. Cisco Systems
11.8. NEC Corporation
11.9. Genetec
11.10. Huawei Technologies
Download Sample
Choose License Type
2850
5250
4500
1800
Frequently Asked Questions
The Global Safe City Market was valued at USD 25.23 billion in 2024 and is projected to reach a market size of USD 71.64 billion by the end of 2030. Over the forecast period of 2025-2030, the market is projected to grow at a CAGR of 23.21%.
In the Solution segment, Video Surveillance is said to lead this market with a market share of 34%. This segment is driven by AI-enabled cameras and analytics upgrades.
During the epidemic, it spurred fast deployment of thermal scanners, mask-detection, and crowd analytics, which increased spending on safe-city by 10–15%.
The Asia-Pacific region is said to dominate the market. Led by China's national smart‑city projects and India's urban‑safety initiatives, Asia Pacific is growing at about 12% CAGR.
Key obstacles to execution continue to be high initial expenses, rules on data privacy, and system legacy integration.


