Global Payment As A Service Market Research Report – Segmentation By Component (Platform, Services), By Service Type (Managed Services, Professional Services), By Deployment Mode (Cloud, On-premises), By Enterprise Size (Large Enterprises, SMEs), By Region – Forecast (2025 – 2030)
Published: 2024 - January
Report Code: IM-2292
Format:


Region: Global
Market Size and Overview:
The Global Payment As A Service Market was valued at USD 14.52 billion and is projected to reach a market size of USD 58.77 billion by the end of 2030. Over the forecast period of 2025-2030, the market is projected to grow at a CAGR of 32.26%.
Driven by the rise of e-commerce, digital wallets, and embedded finance, along with growing mobile-commerce volumes, demand is driving. While regulated industries use PaaS to speed compliance and worldwide expansion, providers distinguish themselves with real-time analytics, tokenization, and risk-scoring abilities.
Key Market Insights:
In 2024, the platform licensing fees and subscription had a market share of around 72%. The core gateways and processing engines are considered to be the backbones of the merchant infrastructure.
As small businesses and challenger banks lack in-house operations teams, outsourced fraud monitoring, 24x7 helpdesk, and settlement-reconciliation managed services are growing at a roughly 36% CAGR till 2030.
As omnichannel companies incorporate checkout, subscriptions, and "buy now, pay later" flows, PaaS adoption in 2024 was driven by the retail and e-commerce vertical, which accounted for approximately 28% of total transaction volume.
Payment As A Service Market Drivers:
The recent boom in the e-commerce sector and the rising adoption of digital wallets are some of the greatest market drivers.
Rapid internet retail expansion throughout both developed and developing countries drives the worldwide e-commerce market to exceed USD 8 trillion by 2027, up from USD 5.3 trillion in 2021. Concurrently, digital wallets account for virtually 48.6% of worldwide e-commerce transaction value, expected to rise to 52.5% by 2025, highlighting the need for merchants to use PaaS platforms supporting smooth wallet integration next to cards, BNPL, and local payment methods. Companies using API-first Payment-as-a-Service solutions may integrate new payment methods in days instead of months, cut checkout abandonment by up to 30%, and maximize conversion by automatically displaying the appropriate wallet or local rail depending on customer location and behavior.
There has been a rise in the demand for embedded finance and payments-as-features, leading to the growth of the market.
As non-financial platforms like ride-hailing apps, POS systems, and SaaS products directly incorporate payments and financial services into their user journeys, embedded finance income pools are forecast to triple from USD 43 billion in 2021 to USD 138 billion by 2026. These turnkey PaaS solutions enable platforms to gather transaction income, increase engagement, and strengthen consumer loyalty without creating sophisticated payment stacks internally via white-label digital wallets, SDKs for in-app checkout, and KYC/AML compliance modules. From surrogate lending and wallet-funding capabilities, early adopters say conversion has increased by 20–25%. New revenue lines have also gained considerably.
The market faces regulatory pressures, and the emergence of open banking has redefined the market.
As banks and TPPs reveal safe APIs for account-to-account transactions, consent-driven data sharing, and real-time fraud screening, the deployment of PSD2 in Europe and related open-banking systems in India (UPI), Australia (Consumer Data Right), and beyond, created a USD 31.6 billion open-banking industry in 2024, set to expand at a 27.6% CAGR through 2030. By providing certified, consistent API connectors, abstracting the complexity of several legislative regimes, and speeding compliance deadlines by 3–6 months, PaaS providers profit from these mandates. This not only simplifies banks' responsibilities under the PSD2's robust customer-authentication requirements but also spurs creativity in value-added services like real-time balance checks and instantaneous payouts.
The recent rise of subscription and recurring billing models is driving the growth of the market.
As companies across media, SaaS, and physical goods industries transition to recurring-revenue models, the subscription economy is expected to reach USD 1.5 trillion by 2025, more than doubling from 2020. Payment-as-a-Service platforms with built-in recurring-billing engines, dunning processes, and revenue-recognition modules are in demand to manage complicated tier pricing, usage-based plans, and involuntary churn reduction. Using these PaaS solutions, companies report up to 35% decreases in manual billing work and a 20–30% reduction in payment failures via intelligent payment-method optimization and a proactive retry mechanism.
Payment As A Service Market Restraints and Challenges:
The market faces a challenge from the problem of a fragmented regulatory landscape.
Payment as a Service (PaaS) providers must negotiate a patchwork of licenses, AML/KYC, and data-localization rules that change greatly from country to country. Extending into Europe under PSD2 demands Electronic Money Institution (EMI) or Payment Institution (PI) licensing, while in the U.S., each state enforces its own Money Transmitter License regulations, delaying India-market launches by up to six months. In Africa and Latin America, similar "local entity" or partnership mandates further complicate rollouts, forcing PaaS companies to build region-specific compliance engines. This regulatory fragmentation not only adds considerable development overhead but can extend go-to-market timelines by 3–6 months, straining resources and slowing global expansion efforts.
The costs related to fraud management and regulatory costs are quite high, posing a major challenge for the market.
Sophisticated fraud techniques have increased as real-time digital payments spread, therefore requiring PaaS companies to devote 20–25% of their income to ML-driven risk engines and secure element integrations. Though necessitating significant GPU infrastructure and specialized personnel, advanced AI-based fraud detection systems can analyze tens of thousands of transactions per second, identifying over 98% of fraudulent activity while maintaining false-positive rates below 2%. According to research, U.S. e-commerce fraud expenses as a portion of income increased 42%, and costs keep going up with mobile-first payments. Though essential for compliance and trust, these investments drive up PaaS prices and reduce profit margins, particularly for low-transaction-volume merchants, who must determine whether the improved security justifies the added price.
The market faces tough competition from banks and other gateways, which are considered challenging for the growth of the market.
Offering "PayFac as a Service" (PFaS) and embedded-gateway solutions, traditional acquirers and card networks are increasingly encroaching on PaaS territory. Mastercard's PFaS white paper shows how sponsor acquirers may enable ISVs to become payment facilitators in weeks instead of months by combining KYC compliance, risk management, and licensing into turn-key products. Capitalizing on Visa's brand credibility and worldwide reach, Authorize.Net, a Visa subsidiary and one of the oldest payment gateways, uses its parent company's network to provide flawless API access and fraud prevention. To keep market share against well-funded incumbents, fintech PaaS companies under these increased competition pressures must constantly innovate on pricing models, developer experience, and value-added analytics.
The integration process for Enterprise IT is complex in nature, which hinders market development.
Modern, event-driven PaaS APIs present major problems for big companies with monolithic ERPs and old checkout systems. Legacy systems often use batch-oriented data flows and proprietary interfaces, therefore needing custom middleware or iPaaS layers that may raise implementation costs by 15–20% and postpone projects for several months. API sprawl makes the problem worse: as every SaaS and PaaS integration adds its own endpoints and versioning needs, governing them safely calls for centralized API management systems and rigorous lifecycle rules. Data anomalies and reconciliation mistakes can undercut the very agility and cost-savings PaaS pledges without this investment, therefore causing businesses to move slowly or stagger their adoption schedules.
Payment As A Service Market Opportunities:
The expansion of cross-border and multi-currency payments is seen as a major market opportunity.
With sales of USD 2.83 trillion expected to rise at a 21.6% CAGR to USD 16.45 trillion, cross-border e-commerce highlights businesses' need for worldwide payment systems. Merchants may provide the buyer's preferred local payment option thanks to PaaS providers who naturally enable FX-routing, dynamic currency conversion, and local rails (ACH in the U.S., SEPA in Europe, UPI in India). These systems help to lower checkout abandonment by as much as 30% and raise average order amounts by 12% by automatically choosing the best corridor and exchange rate. PaaS companies with strong multi-currency wallets and worldwide payment networks are ready to dominate the retail, travel, and digital goods industries as cross-border e-commerce is expected to reach USD 2 trillion by 2027.
The emergence of SME-focused embedded lender services is considered to be an important market opportunity to grow further.
At a 29.6% CAGR, the worldwide Buy-Now-Pay-Later (BNPL) market is expected to rise from USD 6.51 billion to USD 23.73 billion by 2028. PaaS platforms can take advantage of this expansion by incorporating lending capabilities such as point-of-sale loans and revolving credit directly into merchant checkouts. By providing ready-to-use SDKs for "pay-later" financing, these providers let SMEs upsell consumers with very little underwriting friction. Merchants, including embedded BNPL, see cart conversion rise 15–20% and a 30% higher average order value. Additionally, PaaS providers may generate recurring revenue from transaction volume expansion by means of interchange spreads and financing fees.
The rapid use of tokenization and wallet-lite technologies is bringing innovation to the market.
Tokenization services have become necessary PaaS additions in answer to consumer worries over card-data exposure and tougher PCI-DSS standards. By replacing raw PANs with single-use tokens kept either server-side or inside “wallet-lite” SDKs on customer devices, platforms provide wholly PCI-compliant, serverless payment experiences. Early adopters, such as prominent e-tailers, using cloud-hosted token vaults have achieved 98% reductions in sensitive-data breach risk and cut integration time by 50%. PaaS companies providing sophisticated tokenization and wallet-lite features can command premium pricing and encourage closer merchant stickiness as regulators all around call for zero-trust architectures and more robust data controls.
The utilization of value-added data analytics and insights will help the market improve its performance.
Merchants increasingly look beyond "plumbing" for strategic, transaction-level insight that guides business decisions. Incorporating real-time analytics dashboards with churn predictors, customer-lifetime-value (CLV) models, and geospatial spending heatmaps, PaaS platforms convert payment data into practical insights. Retailers using these tools report 20% improvements in retention and 15% uplift in targeted marketing ROI. Predictive-model APIs enable dynamic risk scoring and payment-method optimization, reducing failed transactions by 25%. PaaS providers who develop into analytics partners will capture a greater wallet share and move from transactional utilities to vital strategic allies as the distinction between payments and business blurs.
Payment As A Service Market Segmentation:
Market Segmentation: By Component
• Platform
• Services
The Platform Segment is said to dominate this market. In 2025, platform revenues, including core payment-engine subscriptions, gateway licensing, and API access, accounted for nearly 72% of the PaaS market as merchants give fundamental infrastructure top importance ahead of ancillary services. The Services segment is the fastest-growing segment. Driven by SMEs and regional banks without in-house operations teams and looking for fully outsourced payment features, managed services (fraud monitoring, settling reconciliation), and professional services (integration, tailoring) are growing at an estimated 36% CAGR.
Market Segmentation: By Service Type
• Managed Services
• Professional Services
The Managed Services segment dominates this market, with about 60% of the services revenue coming from daily operations, 24×7 fraud surveillance, chargeback processing, and reconciliation, as ongoing monitoring is essential for fraud prevention and compliance. The Professional Services segment is said to be the fastest-growing one, as businesses seek tailored checkout experiences and sophisticated multi-rail integrations to set their products apart. Execution, API integration, and bespoke feature development are expanding most quickly (roughly 38% CAGR).
Market Segmentation: By Deployment Mode
• Cloud
• On-premises
The Cloud segment dominates the market with roughly 85% of deployments. Cloud-hosted PaaS is dominant, using hyperscalers' worldwide data centers for flexible scaling, multi-region redundancy, and rapid feature roll-out without significant upfront CapEx. The On-premises segment is the fastest-growing segment of the market. On-Premises PaaS, deployed within corporate firewalls, is the fastest-growing (≈24% CAGR), as regulated industries (e.g., defense, healthcare) insist on full data sovereignty and ultra-low-latency processing.
Market Segmentation: By Enterprise Size
• Large Enterprises
• SMEs
The Large Enterprises Segment dominates this market, big Companies investing mostly in high-volume transaction processing, sophisticated risk tools, and worldwide payment-rail integration. Big merchants and financial institutions make up about 68% of PaaS spending. The SMEs segment is the fastest-growing segment of the market. Driven by e-commerce expansion in emerging markets, SMEs are the fastest-growing segment (≈33% CAGR), embracing turnkey PaaS to swiftly create digital storefronts without creating in-house payment infrastructure.
Market Segmentation: By Region
• North America
• Asia-Pacific
• Europe
• South America
• Middle East and Africa
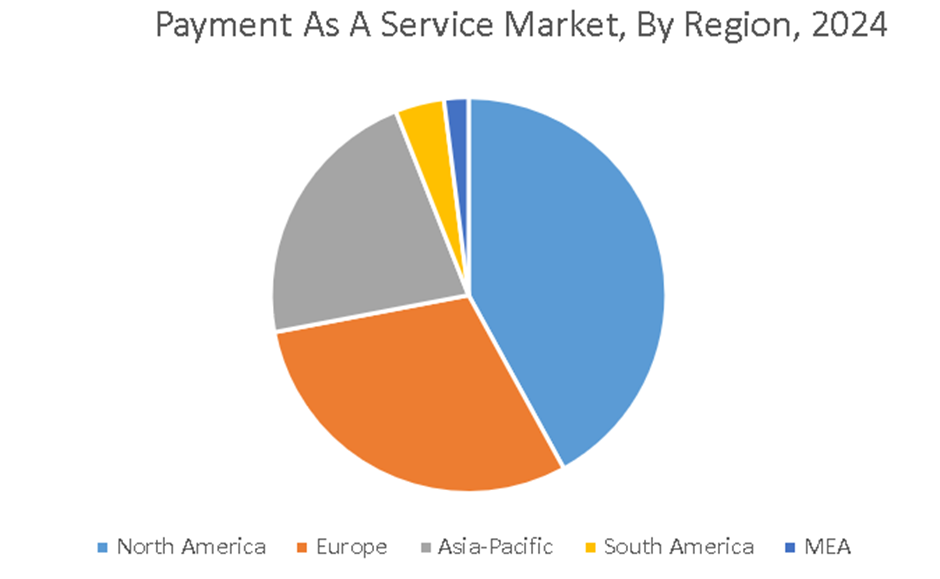
North America has emerged as the leader of this market. With large e-tailers, technology platform integrations, and sophisticated fintech ecosystems at the forefront, the U.S. and Canada generate around 38% of all PaaS revenues. The Asia-Pacific region is considered the fastest-growing region of the market. Driven by super-app ecosystems in China, widespread adoption of digital wallets in India, and cross-border e-commerce growth across Southeast Asia, APAC's PaaS market is expanding at about 37% CAGR.
Europe is the second-largest market due to Open-rail integrations driven by PSD2 and the digital commerce rebound. Both South America and the MEA regions are emerging markets, using PaaS for mobile payments, with Brazil and Mexico's fast uptake of fintech. Projects on smart cities in the GCC and mobile-money platforms in Africa encourage expansion.
COVID-19 Impact Analysis on the Global Payment As A Service Market:
The pandemic sped up contactless and online payments: global digital-payment volumes increased 27% in 2020, with small enterprises using PaaS to quickly establish online stores in weeks rather than months. Mobile checkouts increased by 40% as a result of lockdowns; therefore, PaaS companies hurriedly released SDKs for in-app wallets and QR-code billing. Although core volumes settled after 2021, 62% of merchants report maintaining high PaaS consumption to support hybrid sales channels and future-proof against physical-channel disturbances.
Latest Trends/ Developments:
Real-time, machine-learning models built into PaaS detect changing fraud patterns, including account takeover and synthetic IDs, thereby lowering false positives by 50% and preventing 85% of sophisticated threats.
Turnkey BNPL APIs offered by PaaS systems allow merchants to include point-of-sale credit choices with little integration, therefore raising average order values by 22%.
By 2028, voice-assistant SDKs and “smart-device pay” modules will enable smooth recurring payments through wearable and home assistants, handling over 5 billion transactions.
PaaS providers are working with central banks' sandbox initiatives to test CBDC-ready payment networks and tokenized-asset settlement, therefore positioning themselves for future digital-currency applications.
Key Players:
• Stripe
• PayPal Holdings, Inc.
• Worldplay, Inc.
• Adyen
• Fiserv, Inc.
• Checkout
• Braintree
• Rapyd
• Square, Inc.
• Finix, Inc.
Chapter 1. Global Payment As A Service Market–Scope & Methodology
1.1. Market Segmentation
1.2. Scope, Assumptions & Limitations
1.3. Research Methodology
1.4. Primary Sources
1.5. Secondary Sources
Chapter 2. Global Payment As A Service Market– Executive Summary
2.1. Market Size & Forecast – (2025 – 2030) ($M/$Bn)
2.2. Key Trends & Insights
2.2.1. Demand Side
2.2.2. Supply Side
2.3. Attractive Investment Propositions
2.4. COVID-19 Impact Analysis
Chapter 3. Global Payment As A Service Market– Competition Scenario
3.1. Market Share Analysis & Company Benchmarking
3.2. Competitive Strategy & Development Scenario
3.3. Competitive Pricing Analysis
3.4. Supplier-Distributor Analysis
Chapter 4. Global Payment As A Service Market Entry Scenario
4.1. Regulatory Scenario
4.2. Case Studies – Key Start-ups
4.3. Customer Analysis
4.4. PESTLE Analysis
4.5. Porters Five Force Model
4.5.1. Bargaining Power of Suppliers
4.5.2. Bargaining Powers of Customers
4.5.3. Threat of New Entrants
4.5.4. Rivalry among Existing Players
4.5.5. Threat of Substitutes
Chapter 5. Global Payment As A Service Market- Landscape
5.1. Value Chain Analysis – Key Stakeholders Impact Analysis
5.2. Market Drivers
5.3. Market Restraints/Challenges
5.4. Market Opportunities
Chapter 6. Global Payment As A Service Market- By Component
6.1. Introduction/Key Findings
6.2. Platforms
6.3. Services
6.4. Y-O-Y Growth trend Analysis By Component
6.5. Absolute $ Opportunity Analysis By Component, 2025-2030
Chapter 7. Global Payment As A Service Market– By Service Type
7.1 Introduction/Key Findings
7.2. Managed Services
7.3. Professional Services
7.4. Y-O-Y Growth trend Analysis By Service Type
7.5. Absolute $ Opportunity Analysis By Service Type, 2025-2030
Chapter 8. Global Payment As A Service Market– By Deployment Mode
8.1. Introduction/Key Findings
8.2. Cloud
8.3. On-premise
8.4. Y-O-Y Growth trend Analysis By Deployment Mode
8.5. Absolute $ Opportunity Analysis By Deployment Mode, 2025-2030
Chapter 9. Global Payment As A Service Market– By Enterprise Size
9.1. Introduction/Key Findings
9.2. Large Enterprises
9.3. SMEs
9.4. Y-O-Y Growth trend Analysis By Enterprise Size
9.5. Absolute $ Opportunity Analysis By Enterprise Size, 2025-2030
Chapter 10. Global Payment As A Service Market, By Geography – Market Size, Forecast, Trends & Insights
10.1. North America
10.1.1. By Country
10.1.1.1. U.S.A.
10.1.1.2. Canada
10.1.1.3. Mexico
10.1.2. By Component
10.1.3. By Service Type
10.1.4. By Deployment Mode
10.1.5. By Enterprise Size
10.1.6. By Region
10.2. Europe
10.2.1. By Country
10.2.1.1. U.K.
10.2.1.2. Germany
10.2.1.3. France
10.2.1.4. Italy
10.2.1.5. Spain
10.2.1.6. Rest of Europe
10.2.2. By Component
10.2.3. By Service Type
10.2.4. By Deployment Mode
10.2.5. By Enterprise Size
10.2.5. By Region
10.3. Asia Pacific
10.3.1. By Country
10.3.1.1. China
10.3.1.2. Japan
10.3.1.3. South Korea
10.3.1.4. India
10.3.1.5. Australia & New Zealand
10.3.1.6. Rest of Asia-Pacific
10.3.2. By Component
10.3.3. By Service Type
10.3.4. By Deployment Mode
10.3.5. By Enterprise Size
10.3.6. By Region
10.4. South America
10.4.1. By Country
10.4.1.1. Brazil
10.4.1.2. Argentina
10.4.1.3. Colombia
10.4.1.4. Chile
10.4.1.5. Rest of South America
10.4.2. By Component
10.4.3. By Service Type
10.4.4. By Deployment Mode
10.4.5. By Enterprise Size
10.4.6. By Region
10.5. Middle East & Africa
10.5.1. By Country
10.5.1.1. United Arab Emirates (UAE)
10.5.1.2. Saudi Arabia
10.5.1.3. Qatar
10.5.1.4. Israel
10.5.1.5. South Africa
10.5.1.6. Nigeria
10.5.1.7. Kenya
10.5.1.8. Egypt
10.5.1.9. Rest of MEA
10.5.2. By Component
10.5.3. By Service Type
10.5.4. By Deployment Mode
10.5.5. By Enterprise Size
10.5.6. By Region
Chapter 11. Global Payment As A Service Market– Company Profiles – (Overview, Product Portfolio, Financials, Strategies & Developments, SWOT Analysis)
11.1. Stripe
11.2. PayPal Holdings, Inc.
11.3. Worldplay, Inc.
11.4. Adyen
11.5. Fiserv, Inc.
11.6. Checkout
11.7. Braintree
11.8. Rapyd
11.9. Square, Inc.
11.10. Finix, Inc.
Download Sample
Choose License Type
2850
5250
4500
1800
Frequently Asked Questions
The Global Payment As A Service Market was valued at USD 14.52 billion and is projected to reach a market size of USD 58.77 billion by the end of 2030 with a CAGR of 32.26%.
North America, with a market share of 38%, is said to dominate this market due to increased fintech adoption, mature e-commerce, and a large number of leading PaaS providers.
Healthcare expenses are increasing at a ~31% CAGR as hospitals and clinics embrace contactless billing, telehealth-integrated payments, and automated claims reconciliation.
Lockdowns and social distancing caused a 27% increase in digital payments in 2020, therefore speeding merchant migration to PaaS for fast internet-store launches and frictionless checkout applications.
Look for AI-powered fraud analytics modules, embedded BNPL APIs, voice-activated pay SDKs, and central-bank-sandbox experiments for CBDCs, all of which offer fresh income and security possibilities.


